
(Sisu user? Want to skip to the product updates? Click here).
---
One of the fundamentals of sales (maybe THE fundamental) is that you need to "know your numbers".
A mentor of mine told me he has two business mottos, "Know Your Business" and "If The People Are Eating, Keep Feeding 'Em".
Know What You're Doing and then Do More of What Works. Fundamentals. You execute on those fundamentals, you win. You do it at scale, you grow.
"Know Your Numbers"... does that mean every number?
There's some brainiacs in this industry who can rip off every little number in their business. You've heard them on stage. It's rare when somebody can list off:
- Exactly how many leads it takes to create an appointment
- How many dials to get a conversation
- Conversations to set an appointment
- Conversion rates from appointment set > closed (Cohort Dashboards)
- Cost per closing, profit per closing...
Etc Etc.
So when somebody gets up on stage and starts shooting out these types of numbers, it sounds impressive. Because it's rare. Most people don't have a clue on this stuff, or the clue that they have is based on one report that took their admin three days to run back in 2017.
So yes, you can set yourself apart from the rest just by knowing your numbers. By actually knowing your business. Because most don't.
But there's a flip side of this that's dangerous too.
If you start focussing too much on numbers, you lose touch with reality. You turn into a Director of Dashboards. You become someone with a lot of knowledge, but not enough action to make it useful.
So there's a balance here, and it has to do with your approach to The Numbers. You should look at numbers to drive action, and only to drive action.
You need a system that takes no more than 5 minutes of your day and gives you all the insight you need to lead your business. Here's a system that works for our top teams.
You need to intentionally look at numbers daily
Most people glance at numbers every day.
Very few have an intentional, structured system for looking at them and then driving action.
I like a regimented approach, where you have specific numbers that you analyze every day, week and month. Should take no longer than 5 minutes if you have the right reporting set up.
As a sales-focussed team leader, here's what I'd be looking at daily for my real estate business:
Total # of dials so far this week
Total # of conversations so far this week
Connect Rate % this week (Conversations/Dials)
Here's what I'd be looking at weekly (Monday):
# of appointments set last week
Cohort conversion of appointments set 14-28 days ago
Projected net income this month
Projected net income next month
And here's what I'd be looking at monthly (5th day of the month):
# of appointments held last month
Cohort conversion of appointments set 14-60 days ago
Cohort conversion of paid leads generated 14-60 days ago
Actual net income last month
The list would probably grow and change over time, but that's where I'd start. And I'd just be intentional about it. Because everything changes depending on the lense you view things through—and you choose your lense when you choose your metrics of focus.
Backing Up Numbers with Playbooks
This is where the numbers turn from knowledge to power.
You should have a playbook backing up every number that you look at. When the number is blue (off pace), you know what your plan is.
Red Flag: Connect Rates are 4% this week, average is 15% and target is no less than 12%
Playbook: Run health check on numbers to make sure they aren't showing up as spam. Verify that agents are letting the phone ring the whole time. If it's neither of those, analyze the leads being called and figure out what's different about them compared to our normal.
Red Flag: Cohort Analysis shows a 35% show rate on our 14-28 day set appointments. Average is 60% and target range is no less than 50%.
Playbook: Is our calendar system sending the right notifications? Are people not getting the invites? If neither of those, did we change something about the script in how these appointments are being set? Is the lead source mix different for this cohort than our normal? Are we setting different types of appointments?
Sometimes, you pull up the dashboard and everything is orange or yellow. In the Sisu world, that means everything is on pace. You're good to go, you have peace of mind that all is well in the world.
Sometimes, it's blue. Somethings cold. And you break out the playbook to fix it.
Reporting Updates in Sisu NEXT that Help You Run Your Business This Way
We just launched some brand new updates in Sisu NEXT around reporting, one of the most exciting being a brand new CEO Dashboard.
New to NEXT? Click the top left hand corner from Sisu Classic. The cool part is that you can use both the new Sisu NEXT version and Sisu Classic at the same time!
Here's a video from our team showing the brand new CEO Dashboard.
CEO Dashboard
The CEO Dashboard is a view we've had heavily requested from a lot of team leaders/brokers. It's the quickest way to know exactly what you've profited each month this year, your month over month expenses, cost of sales, projected net income and more.
It's a great dashboard to mix into your monthly or maybe even weekly reporting regimen.
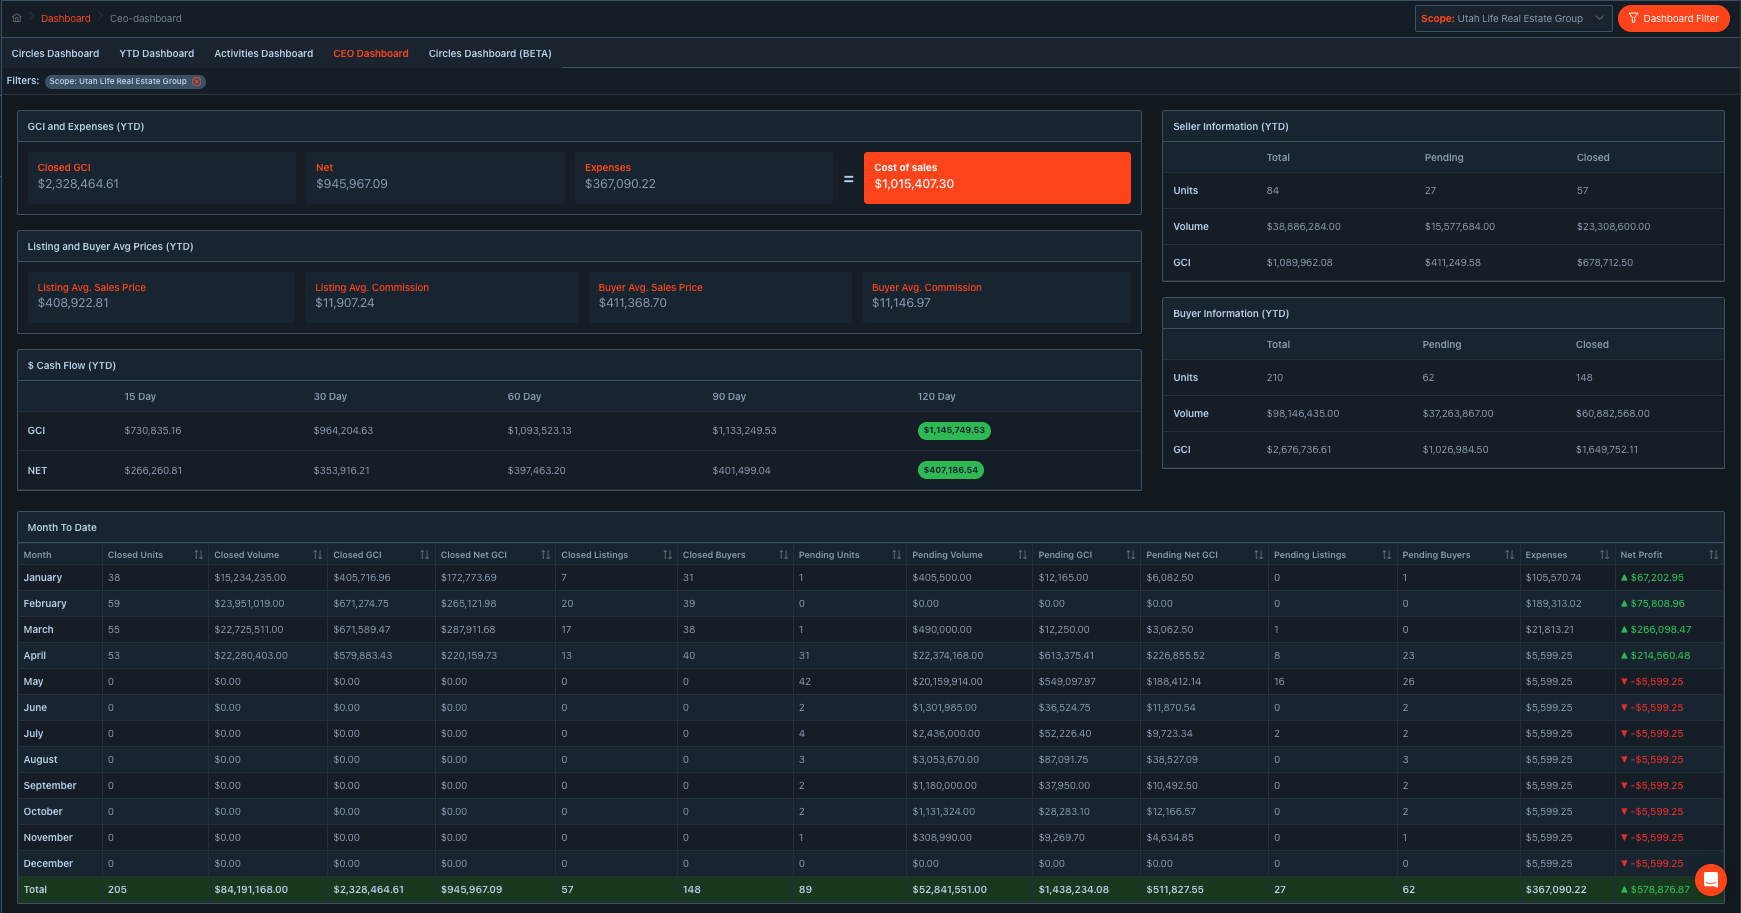
GCI and Expenses (YTD) - Top Left
Closed GCI is the total amount closed on the year. If you sold a listing for 500,000 and your side of the commission was 3%, you would see $15,000 here.
Net is what the team actually kept, i.e. what went into your bank account. If you kept $6,500 after all fees, that's what you would see here.
Expenses are your overhead that's not related to transactions. You enter these from admin > expenses, and they should include all non-transactional expenses such as office space, marketing, and admin salaries.
Cost of Sales is where you'd see transactional expenses represented. So in the example above, if your rep kept $6,500 of the commission and the brokerage/other fees added $2,000, you'd see $8500 as the cost of sales.
Listing and Buyer Average Prices - 2nd Down on Left
These are simply your average price points for buyer transactions and seller transactions, as well as your average commission (GCI) on each side.
$ Cash Flow (YTD) - 3rd Down on Left
- GCI: This displays the upcoming GCI in 15-, 30-, 60-, 90-, and 120-day increments. This includes Closed and Forecasted GCI for the future. The future data begins “tomorrow.”
- Net: This displays the upcoming Net Commission income in 15-, 30-, 60-, 90-, and 120-day increments. This includes Closed and Forecasted Net Commission for the future. The future data begins “tomorrow.”
Month to Date - Bottom Table
This table gives you a month over month breakdown for every month in the year. It's the best place to see trends in your financials.
For more details on how everything is calculated, you can check out a detailed write up in our knowledge base here.
Annualized Snapshot Graphs
Annualized snapshot graphs are a new setting in Sisu NEXT where you can choose to view the annualized, cumulative numbers of any given metric. All you have to do is click the "Annual" toggle at the top of the snapshot in NEXT.
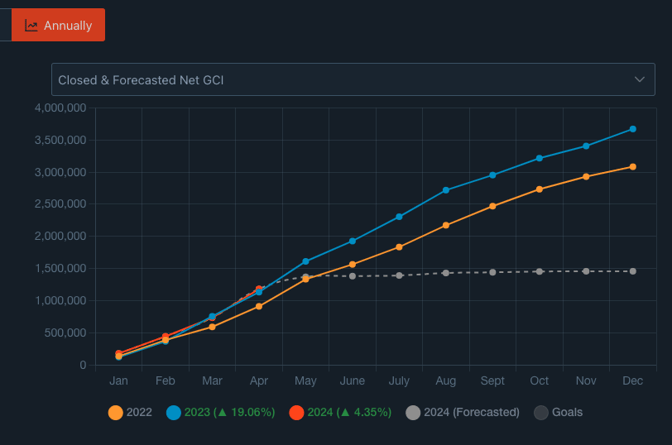
So, for example, in this chart, I can see we are up 4.35% on YTD Closed and Forecasted Net GCI.
On this one, I can see we are actually down on Appointments Met, about 18%.
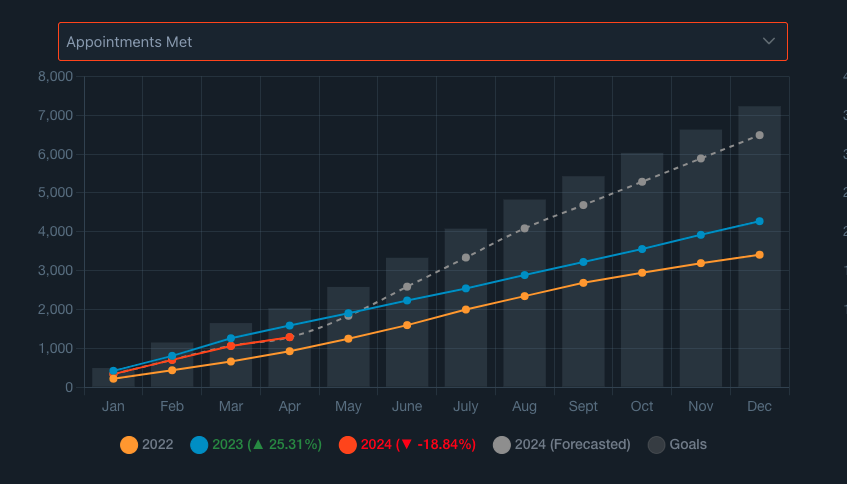
So what does that mean?
That's the golden question. It could mean a lot of things. What matters is that you're asking it.
This should be effortless
You shouldn't need to have extra processes to create this type of reporting, or team members exerting themselves on Sunday's so that your numbers can be ready for Monday team meeting.
The flow of data through your business should just produce this type of data on autopilot.
The team here at Sisu is experts on that. We'll connect your CRM, show you how data flows through the system, and you'll have a fully-loaded Sisu process ready to go before you even have to pay us a dime.
---
(Want to get the updates before everyone else? Subscribe 👇)

.png)